

Most Credit Spread Measures Don’t Indicate Much Risk, But One Of Them Does
Most Credit Spread Measures Don’t Indicate Much Risk, But One Of Them Does
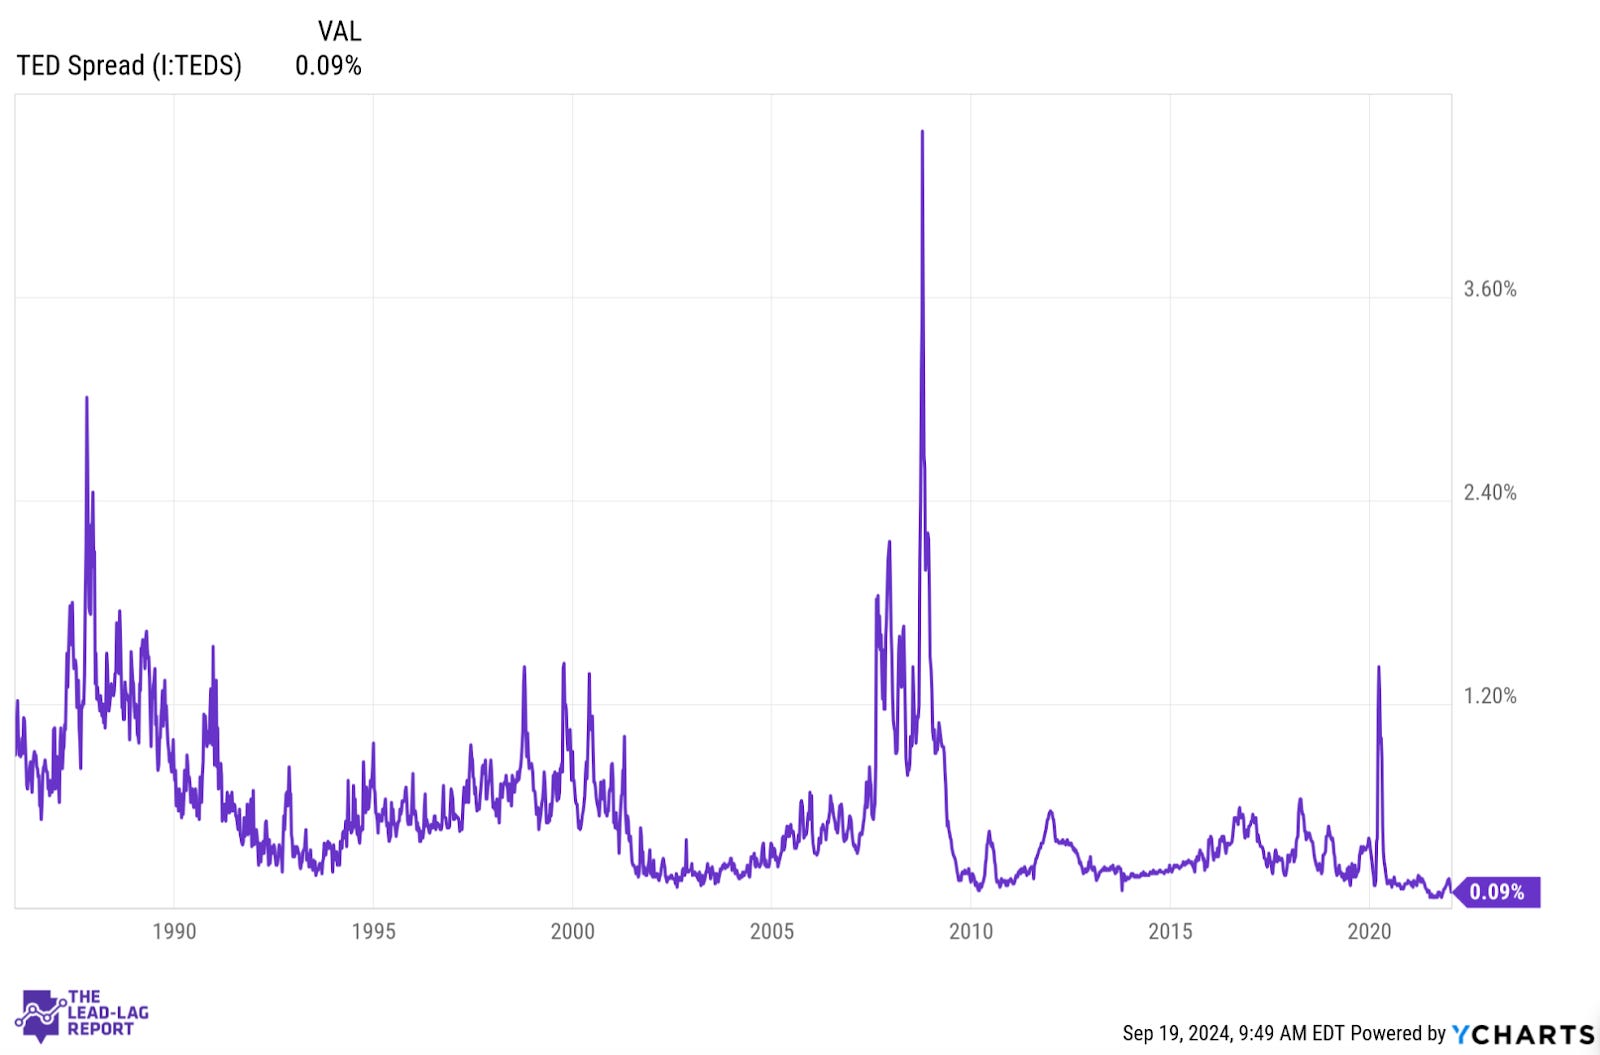
Few understand the TED spread.

I got a note from a subscriber this past week talking about the TED spread. If you’re unfamiliar, the TED spread is the difference between the 3-month LIBOR rate and the 3-month Treasury yield. It was essentially a measure of perceived credit risk in the markets. As the spread widened, it was generally accepted that lending risk among financial institutions was growing. Higher credit risk meant higher interest rates and that widened the gap between these lending rates and risk-free Treasury rates.
Since the LIBOR rate was phased out in 2023, so was the TED spread. The secured overnight financing rate (SOFR) has replaced it and the comparison of this rate to 3-month Treasury yields can also be used as a credit risk proxy.
The TED spread mostly did a good job of signaling stress in the markets - 1987, 1990, the tech bubble, the financial crisis and the COVID pandemic. It also rose in more volatile, yet less prominent periods.
While this chart ends in 2021, we can use another source to identify how the interbank rate/T-bill rate spread correctly picked up on the regional banking crisis of 2023.
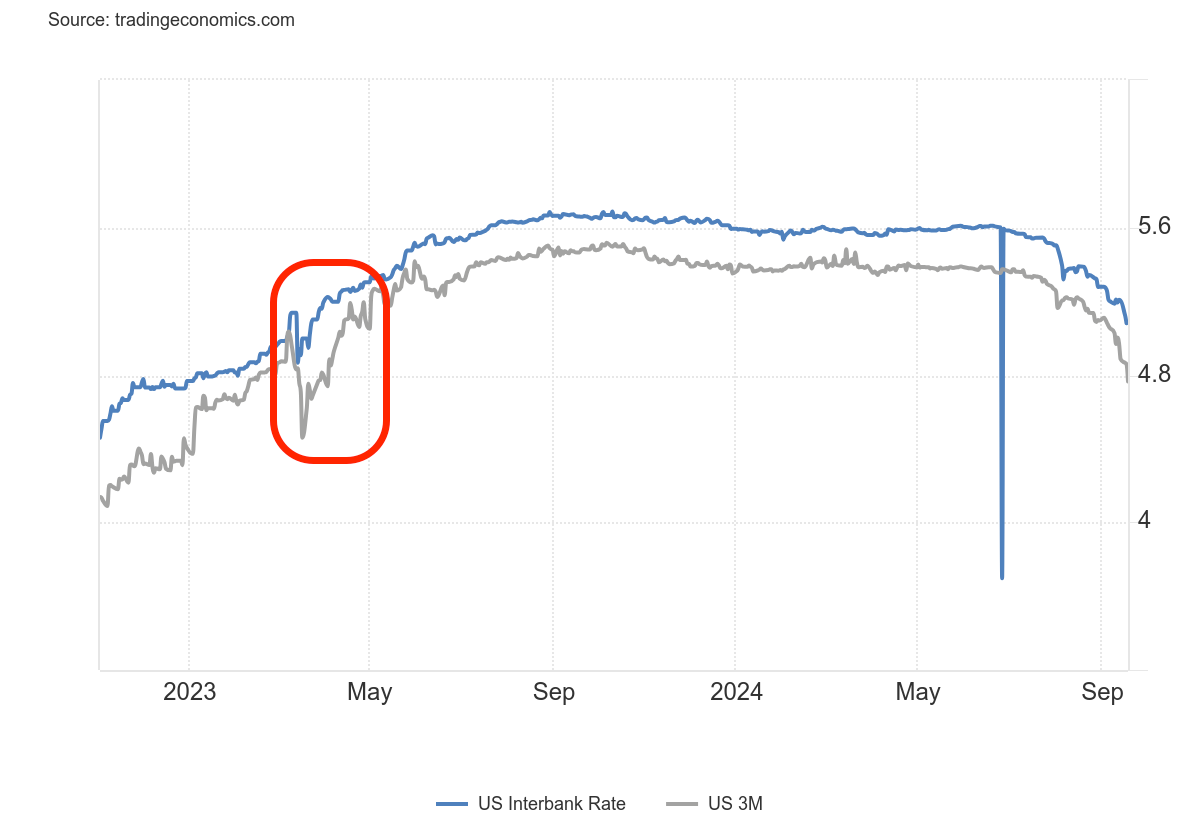
Over the past year, however, we can see that this spread hasn’t moved much at all, roughly oscillating in a range between 15-25 basis points. In other words, it hasn’t been signaling much credit risk at all.
That’s fairly consistent with what we’ve seen out of credit spreads lately. Despite what objectively appear to be rising credit risks on both the consumer and the commercial side, high yield spreads, outside of a few brief, isolated incidents, have stubbornly stuck near historic lows.
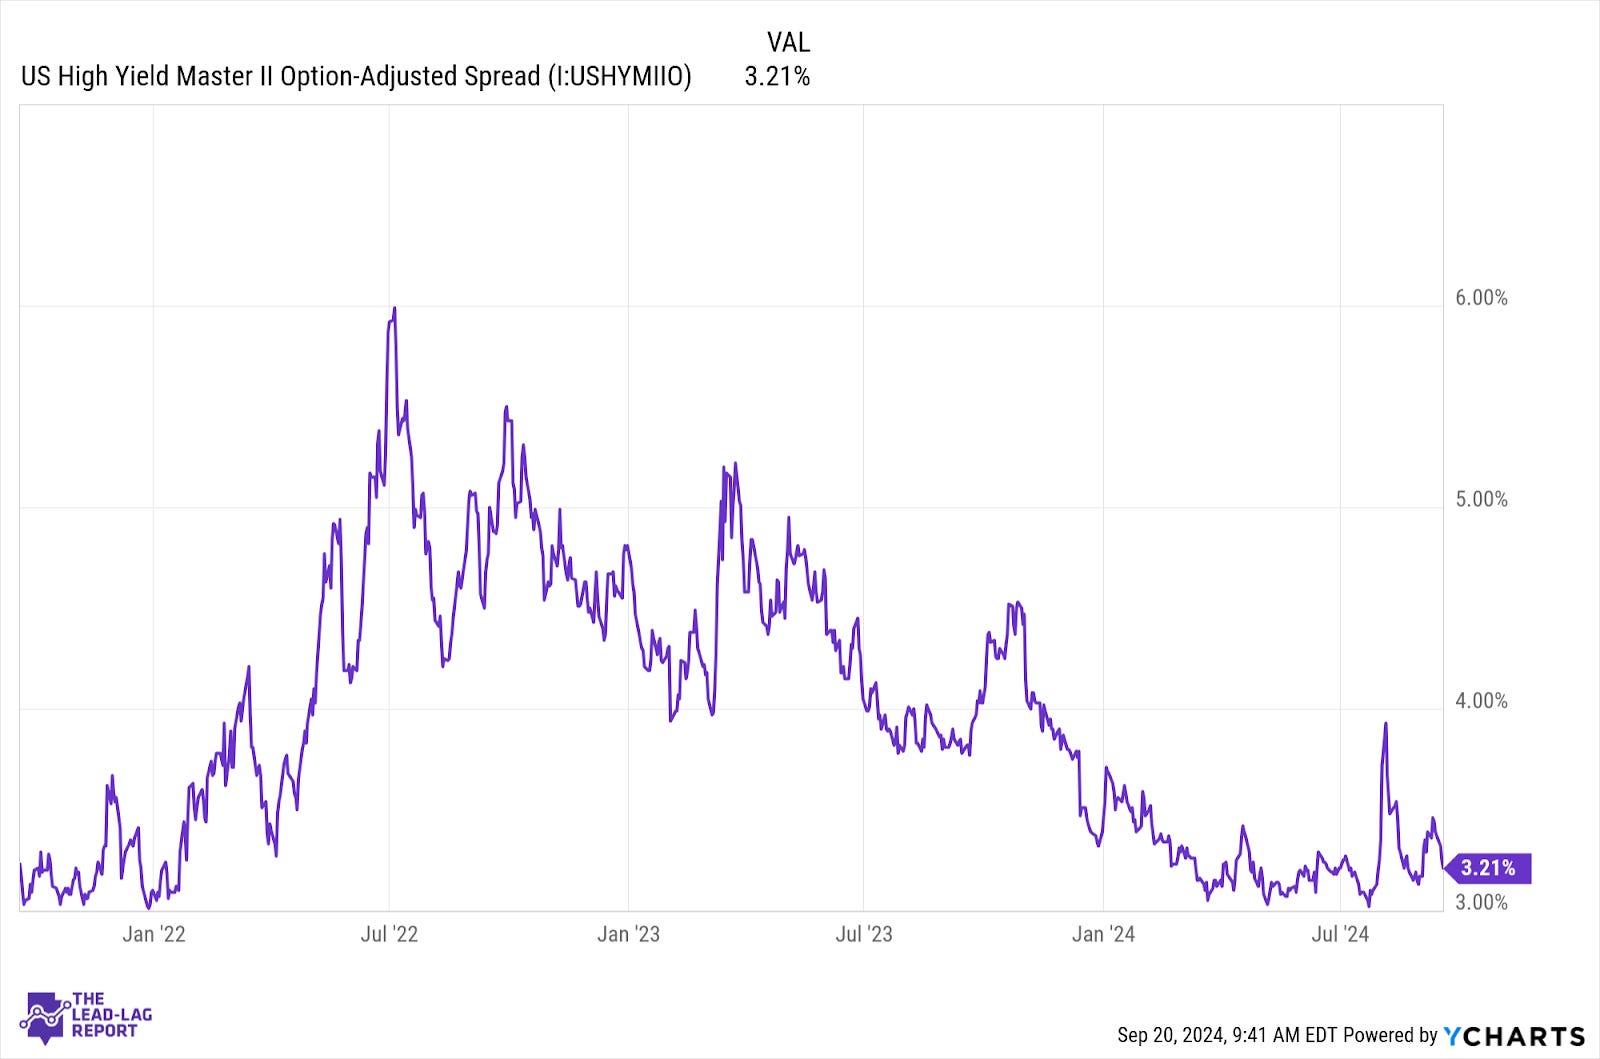
Most notable is the past couple months. We got an unexpectedly low read on inflation, which started some of the uneasiness in the markets, but the reverse yen carry trade was the big “event”. Even that, though, only spiked credit spreads to levels seen just 8 months earlier. As soon as the markets started pricing in Fed rate cuts, spreads started taking the slow elevator down.
If the original TED spread is still low and credit spreads are low, is there any ratio out there that actually is signaling growing risks in the credit market?
Turns out there is. It’s the SOFR/3-month T-bill ratio. It started shooting higher in July, but never stopped rising.
Keep reading with a 7-day free trial
Subscribe to The Lead-Lag Report to keep reading this post and get 7 days of free access to the full post archives.