

An Unbelievably Tricky Juncture
An Unbelievably Tricky Juncture
We Appear To Be In The Credit Event

While there’s a lot of volatility within each of the four risk signals, they remain structurally neutral for the most part (with the exception of the Treasuries signal). The utilities signal snaps back to risk-on in the short-term following last week’s carnage, but is still right about where it was during the beginning of its lookback period. The same goes for the lumber/gold signal, which remains right at its neutral level and could flip back and forth in any given week. I think this volatility within the individual signals is that the markets are really trying to figure out what they believe here. Are they happy with the path of inflation or are they worried about recession? Are they happy that there’s still a relatively robust labor market or are they worried that credit conditions are deteriorating almost everywhere and that’s already affecting businesses?
How To Interpret the Signals: Within each strategy, there is a risk-on and risk-off investment recommendation, with the risk-off option being the more conservative of the two. When a particular signal indicates that investors should be risk-off, for example, subscribers should consider investing in the risk-off option and avoiding the risk-on option. The opposite, therefore, would be true when the signal flips to risk-on. In each strategy, you’d always be invested in one option or the other.
Here’s how to read the scorecard for each strategy:

Some of the strategies will be more aggressive than others. The “Leverage For The Long Run” strategy, for example, uses the S&P 500 and 2x-leveraged S&P 500. The more conservative “Lumber/Gold Bond” strategy, however, uses intermediate-term Treasuries and the S&P 500. In every case, a risk-off signal indicates that you should be invested in the more conservative of the two options, while a risk-on signal indicates you should be invested in the more aggressive one.
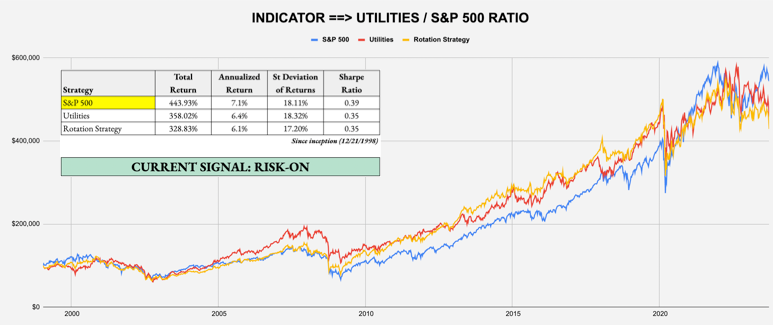
SHORT-TERM SIGNAL: UTILITIES/S&P 500 RATIO
Target Investor: Short-term traders with a higher risk tolerance interested in using an equity momentum strategy to anticipate changes in market risk tolerance.
Current Indicator: Risk-On
Strategy: Beta Rotation - Example: Invest in S&P 500 (SPY) over Utilities (XLU)
SHORT-TERM SIGNAL: LONG DURATION/INTERMEDIATE DURATION TREASURIES RATIO
Target Investor: Short-term traders with a higher risk tolerance who want to use the activity in the U.S. Treasury market to judge overall risk levels.
Current Indicator: Risk-On
Strategy: Tactical Risk Rotation - Example: Invest in S&P 500 (SPY) over Long-Duration Treasuries (VLGSX)

INTERMEDIATE-TERM SIGNAL: LUMBER/GOLD RATIO
Target Investor: Short- and long-term investors willing to trade more frequently using the classic cyclical vs. defensive asset comparison.
Keep reading with a 7-day free trial
Subscribe to The Lead-Lag Report to keep reading this post and get 7 days of free access to the full post archives.