

Brace for Impact: Weekly Risk-Off Signals Begin Pointing to an Imminent Stock Market Correction
Brace for Impact: Weekly Risk-Off Signals Begin Pointing to an Imminent Stock Market Correction
Buckle Up for the Market Rollercoaster

Summary
Last week, we got another advance in the disinflationary trend, the late week bounce in lumber prices and the better-than-expected earnings reports from Citigroup and JPMorgan Chase.
While these developments will likely be viewed as short-term positive for the markets, none of it really changes the long-term macro narrative.
In particular, home sales are slowing because of high mortgage rates while builders continue to put up more single- and multi-family units.
Last week, we got another advance in the disinflationary trend, the late week bounce in lumber prices and the better-than-expected earnings reports from Citigroup and JPMorgan Chase (which should help investors feel confident there is no broad banking crisis). This suggests that the markets may experience one final blowout before the conditions favoring an accident over the next week or two take hold.
About the Signals: The above trade signals and allocations are taken directly from each of the four award winning white papers I authored, which can be individually read at https://papers.ssrn.com/sol3/cf_dev/AbsByAuth.cfm?per_id=2224980. The underlying commonality across all risk-on/off signals and backtested strategies from these papers is the same: what matters isn’t being up more, but rather being down less. Each strategy historically has significantly outperformed through the avoidance of major drawdowns and volatile periods. The signals can change often from week to week, so it’s important to keep checking The Lead-Lag Report for updates. While not every trade and not every signal will be right, cumulatively over time, the identification of conditions that favor an accident in the stock market can help you slow down entering the storm, even if no one knows the exact mile marker where a crash might occur.
How To Interpret the Signals: Within each strategy, there is a risk-on and risk-off investment recommendation, with the risk-off option being the more conservative of the two. When a particular signal indicates that investors should be risk-off, for example, subscribers should consider investing in the risk-off option and avoiding the risk-on option. The opposite, therefore, would be true when the signal flips to risk-on. In each strategy, you’d always be invested in one option or the other.
Here’s how to read the scorecard for each strategy:
Some of the strategies will be more aggressive than others. The “Leverage For The Long Run” strategy, for example, uses the S&P 500 and 2x-leveraged S&P 500. The more conservative “Lumber/Gold Bond” strategy, however, uses intermediate-term Treasuries and the S&P 500. In every case, a risk-off signal indicates that you should be invested in the more conservative of the two options, while a risk-on signal indicates you should be invested in the more aggressive one.
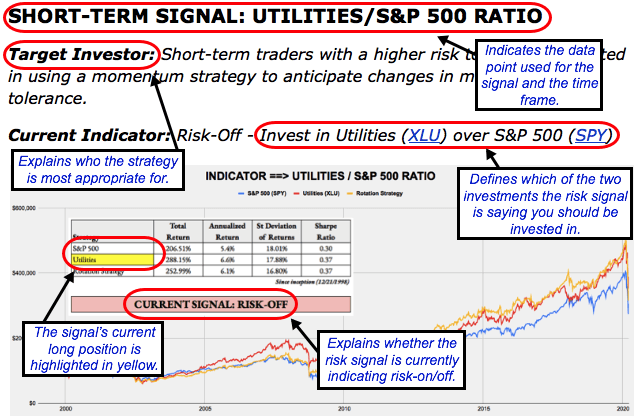
SHORT-TERM SIGNAL: UTILITIES/S&P 500 RATIO
Target Investor: Short-term traders with a higher risk tolerance interested in using an equity momentum strategy to anticipate changes in market risk tolerance.
Current Indicator: Risk-On
Strategy: Beta Rotation - Example: Invest in S&P 500 (SPY) over Utilities (XLU)

SHORT-TERM SIGNAL: LONG DURATION/INTERMEDIATE DURATION TREASURIES RATIO
Target Investor: Short-term traders with a higher risk tolerance who want to use the activity in the U.S. Treasury market to judge overall risk levels.
Current Indicator: Risk-Off
Strategy: Tactical Risk Rotation - Example: Invest in Long-Duration Treasuries (VLGSX) over S&P 500 (SPY)

INTERMEDIATE-TERM SIGNAL: LUMBER/GOLD RATIO
Keep reading with a 7-day free trial
Subscribe to The Lead-Lag Report to keep reading this post and get 7 days of free access to the full post archives.