

PPI Versus CPI
PPI Versus CPI
Disinflation Or Trouble Ahead?

Last week’s return to mega-cap growth leadership looked a whole lot like what we saw throughout 2023 - a handful of tech stocks leading the way, but very little suggesting a broad and healthy rally. Therefore, we shouldn’t dismiss the rally by defensive stocks to start the year as being over yet. Last week’s PPI report confirmed the market’s belief that the disinflation trend will continue, but the CPI report’s indication that above trend consumer inflation is not going away could very well cause trouble as we progress through 2024. If sticky inflation persists and runs into the Fed’s expected rate cutting cycle, the odds of a second wave of inflation go way up and risk another correction in both stocks and bonds.
How To Interpret the Signals: Within each strategy, there is a risk-on and risk-off investment recommendation, with the risk-off option being the more conservative of the two. When a particular signal indicates that investors should be risk-off, for example, subscribers should consider investing in the risk-off option and avoiding the risk-on option. The opposite, therefore, would be true when the signal flips to risk-on. In each strategy, you’d always be invested in one option or the other.
Here’s how to read the scorecard for each strategy:

Some of the strategies will be more aggressive than others. The “Leverage For The Long Run” strategy, for example, uses the S&P 500 and 2x-leveraged S&P 500. The more conservative “Lumber/Gold Bond” strategy, however, uses intermediate-term Treasuries and the S&P 500. In every case, a risk-off signal indicates that you should be invested in the more conservative of the two options, while a risk-on signal indicates you should be invested in the more aggressive one.
For a full user's guide on how to interpret each of the signals and how to put them to work in your portfolio, please click HERE.
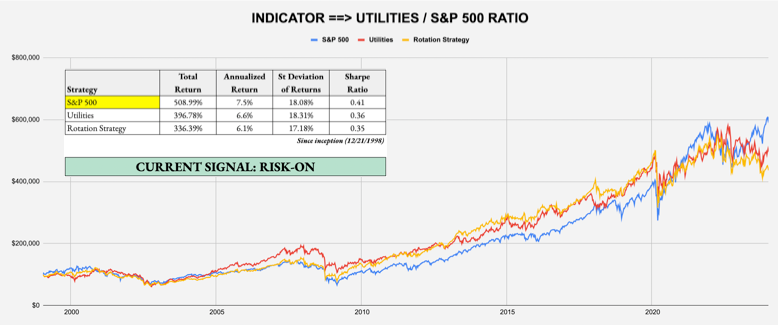
SHORT-TERM SIGNAL: UTILITIES/S&P 500 RATIO
Target Investor: Short-term traders with a higher risk tolerance interested in using an equity momentum strategy to anticipate changes in market risk tolerance.
Current Indicator: Risk-On
Strategy: Beta Rotation - Example: Invest in S&P 500 (SPY) over Utilities (XLU)
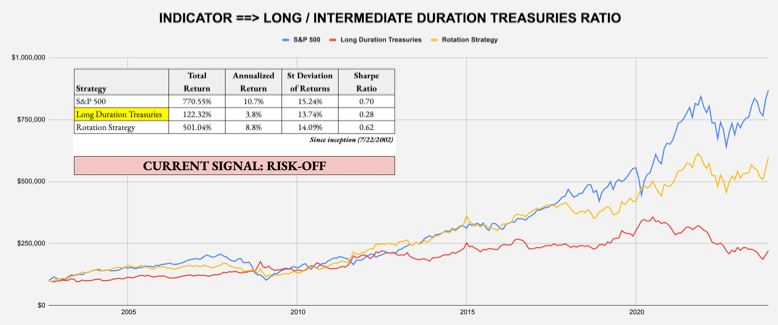
SHORT-TERM SIGNAL: LONG DURATION/INTERMEDIATE DURATION TREASURIES RATIO
Target Investor: Short-term traders with a higher risk tolerance who want to use the activity in the U.S. Treasury market to judge overall risk levels.
Current Indicator: Risk-Off
Strategy: Tactical Risk Rotation - Example: Invest in Long-Duration Treasuries (VLGSX) over S&P 500 (SPY)
INTERMEDIATE-TERM SIGNAL: LUMBER/GOLD RATIO
Target Investor: Short- and long-term investors willing to trade more frequently using the classic cyclical vs. defensive asset comparison.
Keep reading with a 7-day free trial
Subscribe to The Lead-Lag Report to keep reading this post and get 7 days of free access to the full post archives.