

Tech Is Much Weaker Than You Think
Tech Is Much Weaker Than You Think
Positive Catalysts Disappear

Below is an assessment of the performance of some of the most important sectors and asset classes relative to each other with an interpretation of what underlying market dynamics may be signaling about the future direction of risk-taking by investors. The below charts are all price ratios which show the underlying trend of the numerator relative to the denominator. A rising price ratio means the numerator is outperforming (up more/down less) the denominator. A falling price ratio means underperformance.
LEADERS: POSITIVE CATALYSTS ARE GETTING HARDER TO COME BY
Technology (XLK) – The Rally Isn’t As Strong As It Looks

Tech has staged an impressive comeback over the past couple weeks, but it’s been dragging the major averages higher almost all by itself. What’s most interesting is that the advance/decline line on the Nasdaq keeps heading lower despite a 30%+ year-to-date gain. Obviously, the mega-cap names are still driving the market and giving the impression of strength, but the broader market is still struggling.
Communication Services (XLC) – Losing Momentum For Weeks
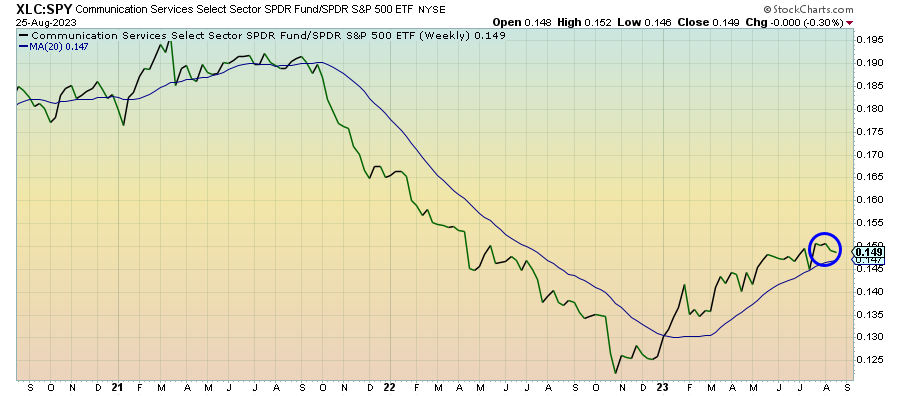
Last week marked a big return for growth and high beta, but communication services stocks failed to keep up. Perhaps it was Disney’s disappointing quarterly results that cast a pall over the entire sector, but this is a group that’s been steadily losing momentum for several weeks. With the market no longer appearing as forgiving as it once was, I’d remain cautious about this sector holding on to its uptrend.
Financials (XLF) – Regionals In A Rough Spot
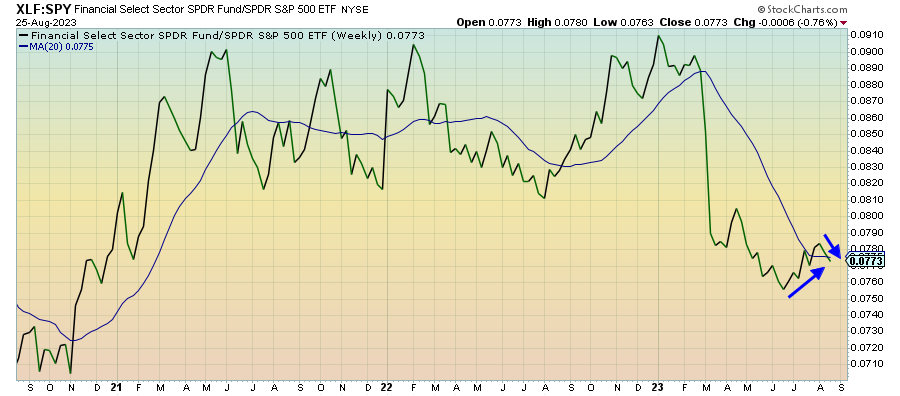
Financials and bank stocks are still holding up here, but with the 3-month Treasury bill hitting its highest yield in more than 20 years, the pressure is going to be on the banks to find ways to expand their margins in light of higher deposit costs. Regional banks, which are mostly heavily exposed to commercial real estate, are in a really rough spot here as much of the sector’s crisis potential has yet to be priced in.
Energy (XLE) – How Hard Will The Cartels Work?

Crude oil prices look supported around the $80 level and that could be helping put a floor under energy stock prices. The big cartels are very interested in holding this level, but the global economic slowdown might test how far they’re willing to play with production levels to sustain it. Weather could begin becoming a seasonal factor as well. We’ve seen a couple spots get temporarily knocked offline and it could keep happening through the hurricane season.
Health Care (XLV) – Still An Opening
Keep reading with a 7-day free trial
Subscribe to The Lead-Lag Report to keep reading this post and get 7 days of free access to the full post archives.