

The Credit Event Is Here
The Credit Event Is Here
Buckle Up

I’ve been talking about it for months. I’ve been closely watching the data. I’ve been monitoring the risk signals. I’ve warned that a credit event is likely coming that could completely reset both the stock and the bond markets. I believe that it’s finally here.
It’s easy to look at the performance of junk bonds relative to the performance of intermediate-term Treasuries pretty much since March and think that everything is normal. You may even look at the chart and think that conditions are very much risk-on at the moment. I look at the chart and I see something else.
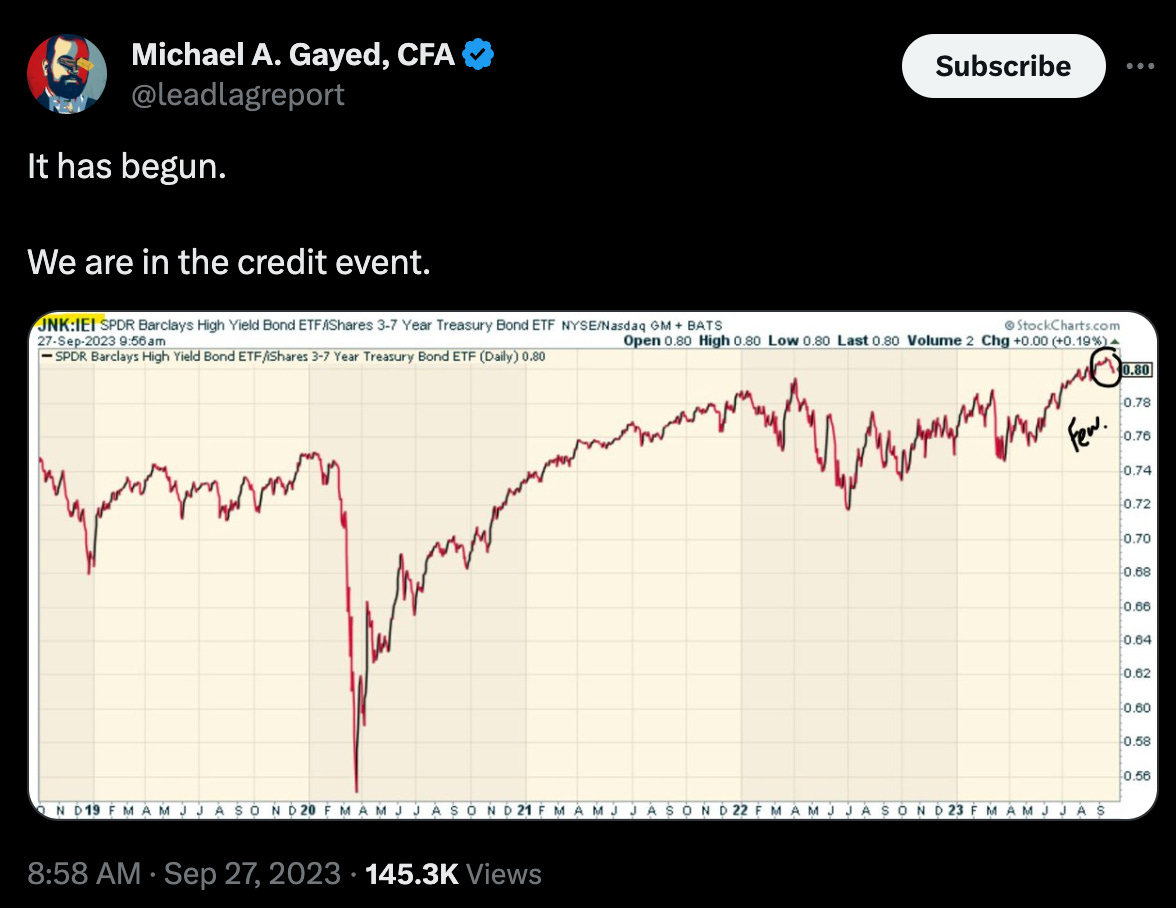
Yes, that little circle over on the right is small and doesn’t look particularly meaningful in the grand scheme of things. Plus, if junk bonds are still only trading at about 2% below their 2023 highs, this doesn’t even really qualify as a pullback, let alone a correction or something indicative of a major shift in the bond market. Right? Actually, it is. Not because of the degree of change, but because of the indicators that are flashing along with it this time around.
Spreads and volatility levels are perhaps the better indicators of both conditions and stress in the bond & stock markets. They’re effectively intertwined, so signs of stress in one market probably means that there’s stress in the other. That’s exactly what we’re seeing right now. Talking yourself into the idea that conditions are normal or even not that bad means that you’re ignoring the data points that clearly demonstrate that things are not fine.
Let’s break them down one by one.
Keep reading with a 7-day free trial
Subscribe to The Lead-Lag Report to keep reading this post and get 7 days of free access to the full post archives.