

The Lazarus Effect: The Current Case For Treasuries & The Dollar
The Lazarus Effect: The Current Case For Treasuries & The Dollar
Opportunities Exist

If you follow me on social media, you see me post this image often.

It’s the phoenix rising from the ashes. I use it to represent the eventual return of my risk rotation strategies that took a beating during the bond bear market of last year. As I’ve said repeatedly, risk rotation strategies are going to have a nearly impossible time if both stocks and bonds are falling 20-30% at the same time, if the expression of risk-off is actually the riskier asset class.
I believe we’ve been seeing conditions starting to turn over the past few weeks. I noted that the 3rd week of April is when conditions favored a market correction occurring. I’ve got a lot of people telling me on Twitter that this hasn’t happened at all. The S&P 500 is roughly breakeven since April 17th, the start of the 3rd week of April. The S&P 100, which measures the performance of the mega-caps, is up nearly 1%. Only marginal gains, but nothing to indicate the start of a big pullback in risk assets.
But look under the surface. Look beyond just the biggest 5-10 stocks in the world. Then you’ll see exactly what I’m talking about.
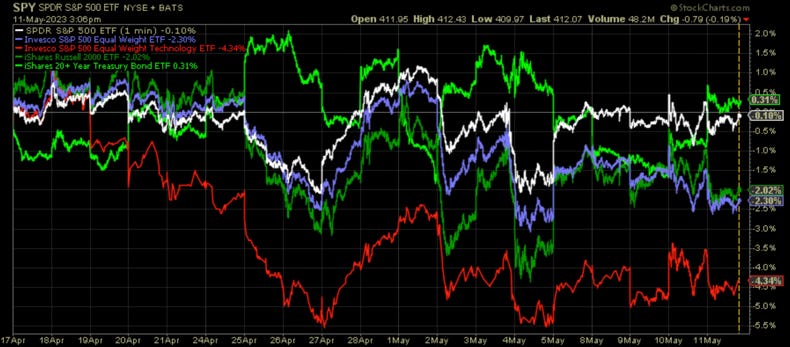
This is a chart I’ve alluded to recently. With the cap-weighted indexes so top-heavy, the equal-weight indexes provide a better sense of what the market is really doing. The equal-weight S&P 500 is down more than 2%. The equal-weight tech sector is down more than 4%. The Russell 200 is also down 2% over the same period. Keep in mind that these returns happened during a period where Q1 earnings reports were generally pretty good, especially among the FAAMG names, we got a lower than expected inflation read and what’s effectively a policy pause from the Fed. Those should have all been positive catalysts, but they haven’t been.
And let’s take another look at small-caps. An uptick in the small-cap/large-cap ratio is considered a sign of market strength and positive sentiment. Instead, the Russell 2000 has been crashing this year relative to the S&P 500 and this ratio has done a full round-trip all the way back to COVID bear market lows.
Keep reading with a 7-day free trial
Subscribe to The Lead-Lag Report to keep reading this post and get 7 days of free access to the full post archives.