

The Rotten Core

Below is an assessment of the performance of some of the most important sectors and asset classes relative to each other with an interpretation of what underlying market dynamics may be signaling about the future direction of risk-taking by investors. The below charts are all price ratios which show the underlying trend of the numerator relative to the denominator. A rising price ratio means the numerator is outperforming (up more/down less) the denominator. A falling price ratio means underperformance.
LEADERS: HOW MUCH LONGER CAN TECH ALONE DRAG THIS MARKET HIGHER
Technology (XLK) – Not Sustainable Long-Term

Last week’s holiday-shortened low volatility market was a perfect opportunity for risk asset prices to advance and that’s exactly what they did. Tech continues to be an unquestioned leader in this market even in the face of questions about valuations and a lack of market breadth. Long-term, this isn’t conducive to a sustainable bull market, but there’s little evidence that investors are willing to consider anything else for the time being.
Consumer Discretionary (XLY) – Pulled Higher By Growth Rally
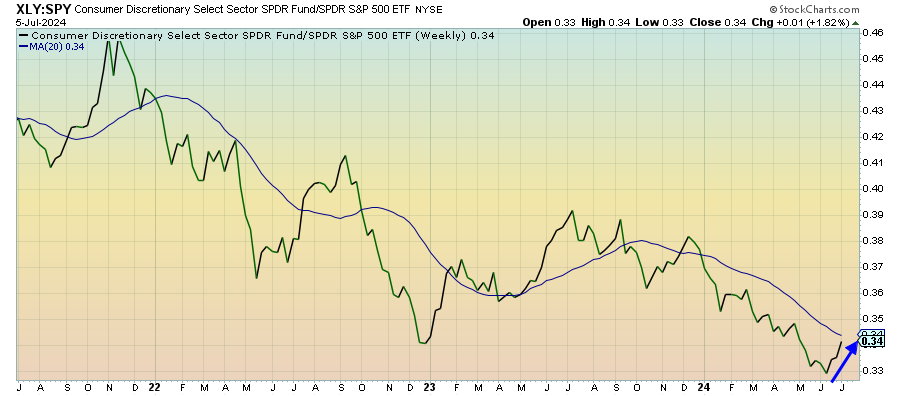
Discretionary stocks are outperforming again, but this looks more like a sector getting pulled higher by the growth stock rally than by genuine fundamentals. Nike and Walgreens recently demonstrated the weakness that exists at the corporate level and slowing retail sales & spending show macro-level struggles building as well. This sector may be OK as long as tech remains strong, but I don’t like the backdrop here.
Energy (XLE) – A Fairly Good Spot For Now
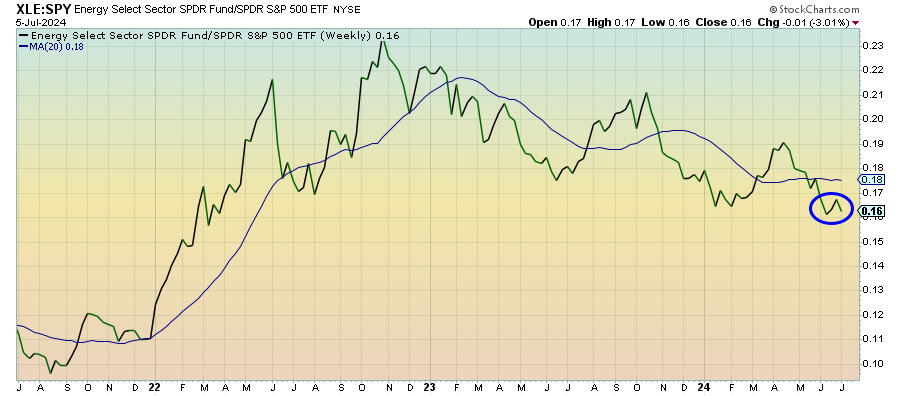
Energy stocks are trying to hang on, but the underperformance of cyclicals, in general, has been like an anchor. We know that production levels are being trimmed on multiple fronts and that alone should help provide support for energy prices. On top of that, there appears to be at least steady, if not growing, demand for gas and oil currently. Energy stocks look like they’re in a fairly good spot for the time being, but downside risk is still elevated.
Treasury Inflation Protected Securities (SPIP) – The Disinflationary Pulse Is Back

The demand for TIPS has slowly been on the increase in 2024, but there’s a fairly easy case to be made that this trend is primed for a pause. Last month’s CPI report resurrected the idea that the disinflationary pulse is back. This week’s report for June, which is expected to show a modest 0.1% increase in prices, could further cement the idea that inflation is under control again.
Junk Debt (JNK) – The Rotten Core
Keep reading with a 7-day free trial
Subscribe to The Lead-Lag Report to keep reading this post and get 7 days of free access to the full post archives.