

Why A Further 20% Drawdown Isn’t Just Possible, It May Be Likely
Why A Further 20% Drawdown Isn’t Just Possible, It May Be Likely
Returns Around Recessions

I’m usually all about identifying conditions that favor changes in risk-on/risk-off market behaviors, but today I want to do something a little different. I want to look purely at the numbers. Specifically, I want to look at S&P 500 returns around past U.S. economic recessions. When I talk about paying close attention to the path of returns, this is exactly what I’m talking about. History never repeats itself exactly, but it often rhymes. By looking back at stock returns around past recessions, we can start to develop a sense of 1) how the S&P 500 might perform if a recession eventually arrives and 2) where we might be in the current cycle.
Since 1950, there have been 11 recessions in the United States.

Each of them has a different length and catalyst, but in terms of stock market returns, there’s a fairly familiar pattern that we see across all of them. The recession of 1981-1982 provides a relatively “plain vanilla” example of how the path of returns generally plays out.

In particular, we usually see stock prices peak and begin declining well ahead of the official start of a recession. They continue declining as the recession drags on, but then bottom and recover as signs of an economic recovery begin to emerge. We’re frequently told that stock prices are the best leading indicator and in recessionary environments, this thesis generally plays out.
To examine history, let’s start with a data table that covers all 11 recessions in one place. There’s a lot of information to unpack here, but some pretty clear takeaways.
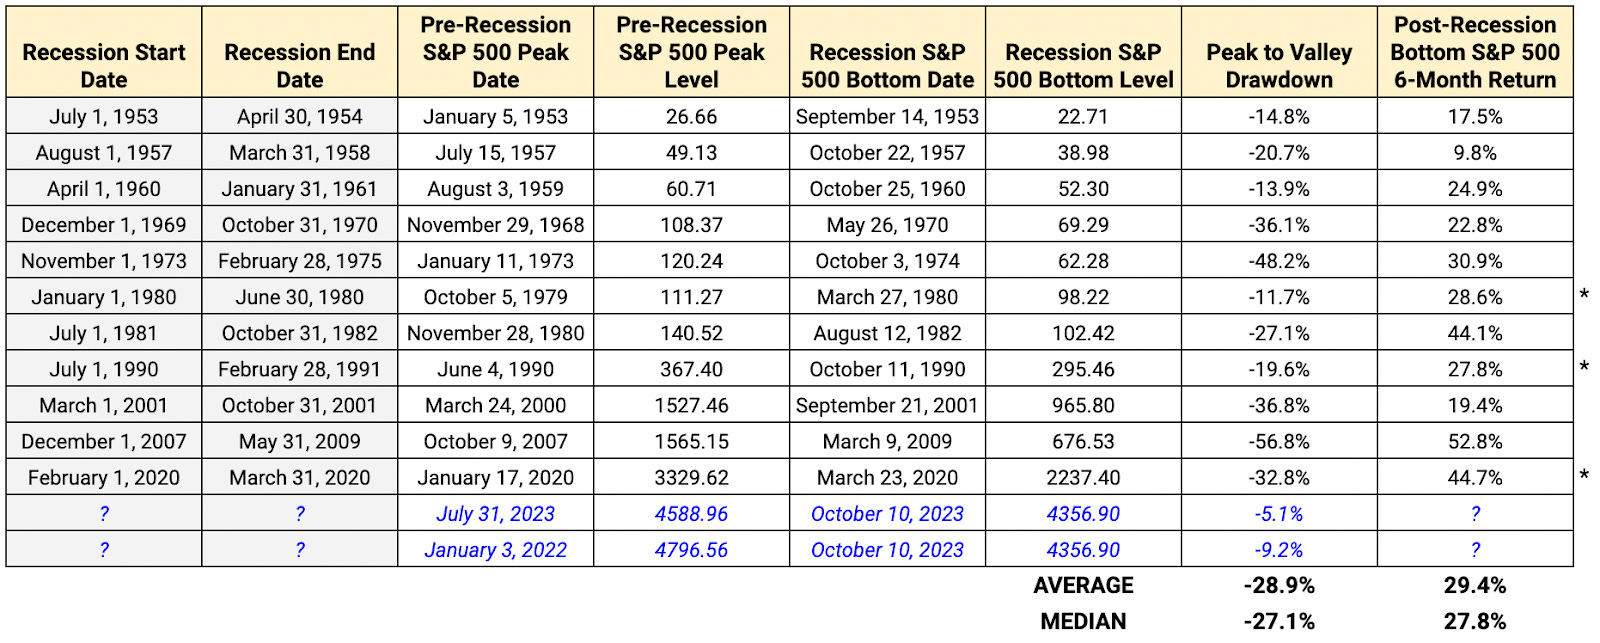
To set the table, the recession start & end dates are fairly self-explanatory. The “pre-recession S&P 500 peak level/date” represents the point at which equity prices peak prior to the official start of a recession. The “recession S&P 500 bottom level/date” is when stock prices hit their valley in the midst of the recession before beginning their recovery. The “peak-to-valley drawdown” should also be self-explanatory. The “post-recession bottom S&P 500 6-month return” is the equity market return in the months following the bottom.
High level takeaways:
Keep reading with a 7-day free trial
Subscribe to The Lead-Lag Report to keep reading this post and get 7 days of free access to the full post archives.