

You Say GameStop. I Say XLU.
You Say GameStop. I Say XLU.
A Different Kind Of Rocket Ship

Below is an assessment of the performance of some of the most important sectors and asset classes relative to each other with an interpretation of what underlying market dynamics may be signaling about the future direction of risk-taking by investors. The below charts are all price ratios which show the underlying trend of the numerator relative to the denominator. A rising price ratio means the numerator is outperforming (up more/down less) the denominator. A falling price ratio means underperformance.
LEADERS: UTILITIES IS THE ROCKET SHIP THAT’S NOT SLOWING DOWN
Utilities (XLU) – The Bears Are Still In Control

Utilities are still on fire, outperforming the S&P 500 by more than 5% over the past two weeks and now reigning as the best performing sector year-to-date. I’ll keep pounding the table that the bears are in control here because, despite the major averages sitting near all-time highs, it’s been utilities, staples, value, low volatility and dividend stocks that have been providing short-term market leadership.
Consumer Staples (XLP) – Risk-Off Is Intensifying
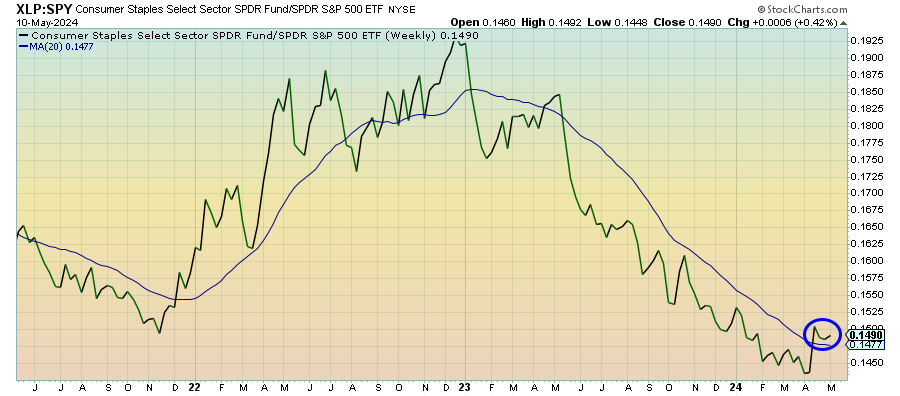
Staples have been relatively slow to respond to the rally in utilities stocks, but it looks like it’s finally starting to happen. This could partially be a reflection of the S&P 500 and Nasdaq 100 still moving higher since a firmer defensive rally has yet to really take shape, but we are definitely seeing a broadening out happening. If this can carry forward at least a couple more weeks, I think there’s going to be no question that the risk-off regime is intensifying.
Financials (XLF) – A Long, Slow Road

Financials are managing to maintain their uptrend relative to the S&P 500, but it’s been a long, slow road. This ratio is still far from where it was in the pre-regional banking crisis and is correctly reflecting the risks that are inherent in this sector. Loan growth is struggling, high interest rates are impacting consumers’ ability to borrow and the number of anecdotes showing that commercial real estate in some cases is being sold off at fire sale prices demonstrate that risks are still high.
Small-Caps (VSMAX) – Tied To Value Outperformance
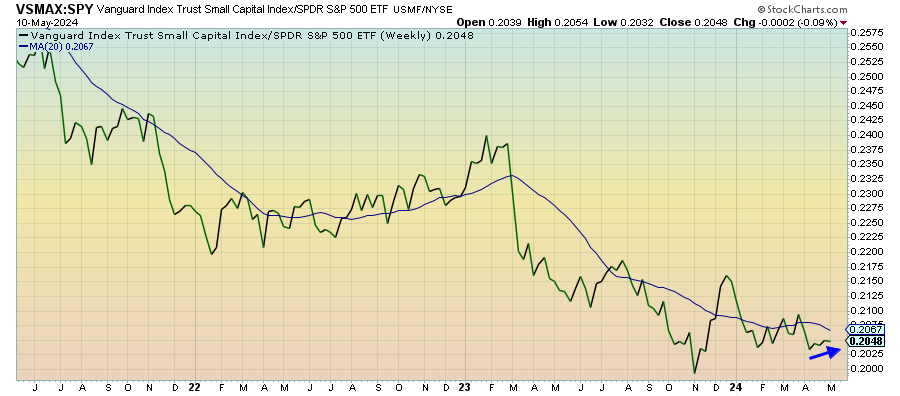
Small-caps are quietly leading large-caps here, which probably isn’t a function of risk-on sentiment as much as it is the value overweight. The current relationship between small- and large-caps is looking a little reminiscent of 2022 where small-caps led despite stocks between down more than 20% at one point from their highs. Based on recent history, small-caps are looking like they could hold up as long as value is continuing to do well.
Dividend Stocks (SDY) – Slow Momentum
Keep reading with a 7-day free trial
Subscribe to The Lead-Lag Report to keep reading this post and get 7 days of free access to the full post archives.